Wardley maps #
I came across a Tweet1 about ‘maps as code’. As a geographer and sometime developer this really piqued my interest. It mentioned Wardley Maps, which is not something I’m at all familiar with. But since this was about using Visual Studio Code to automatically create ‘maps’ from code, I had to follow up. After all, a couple of my all-time favorite tools are PlantUML and MermaidJS.
Maps vs Graphs #
The basic premise is that visualizing elements affecting strategy as a map is the best way to arrive at a strategy quickly, in context.
The fundamental difference between a map and a graph is that in a map, space has meaning.
Graphs have topological connections which help to show connectedness and direction of flows. Maps enhance this by showing how space and specific location matters.
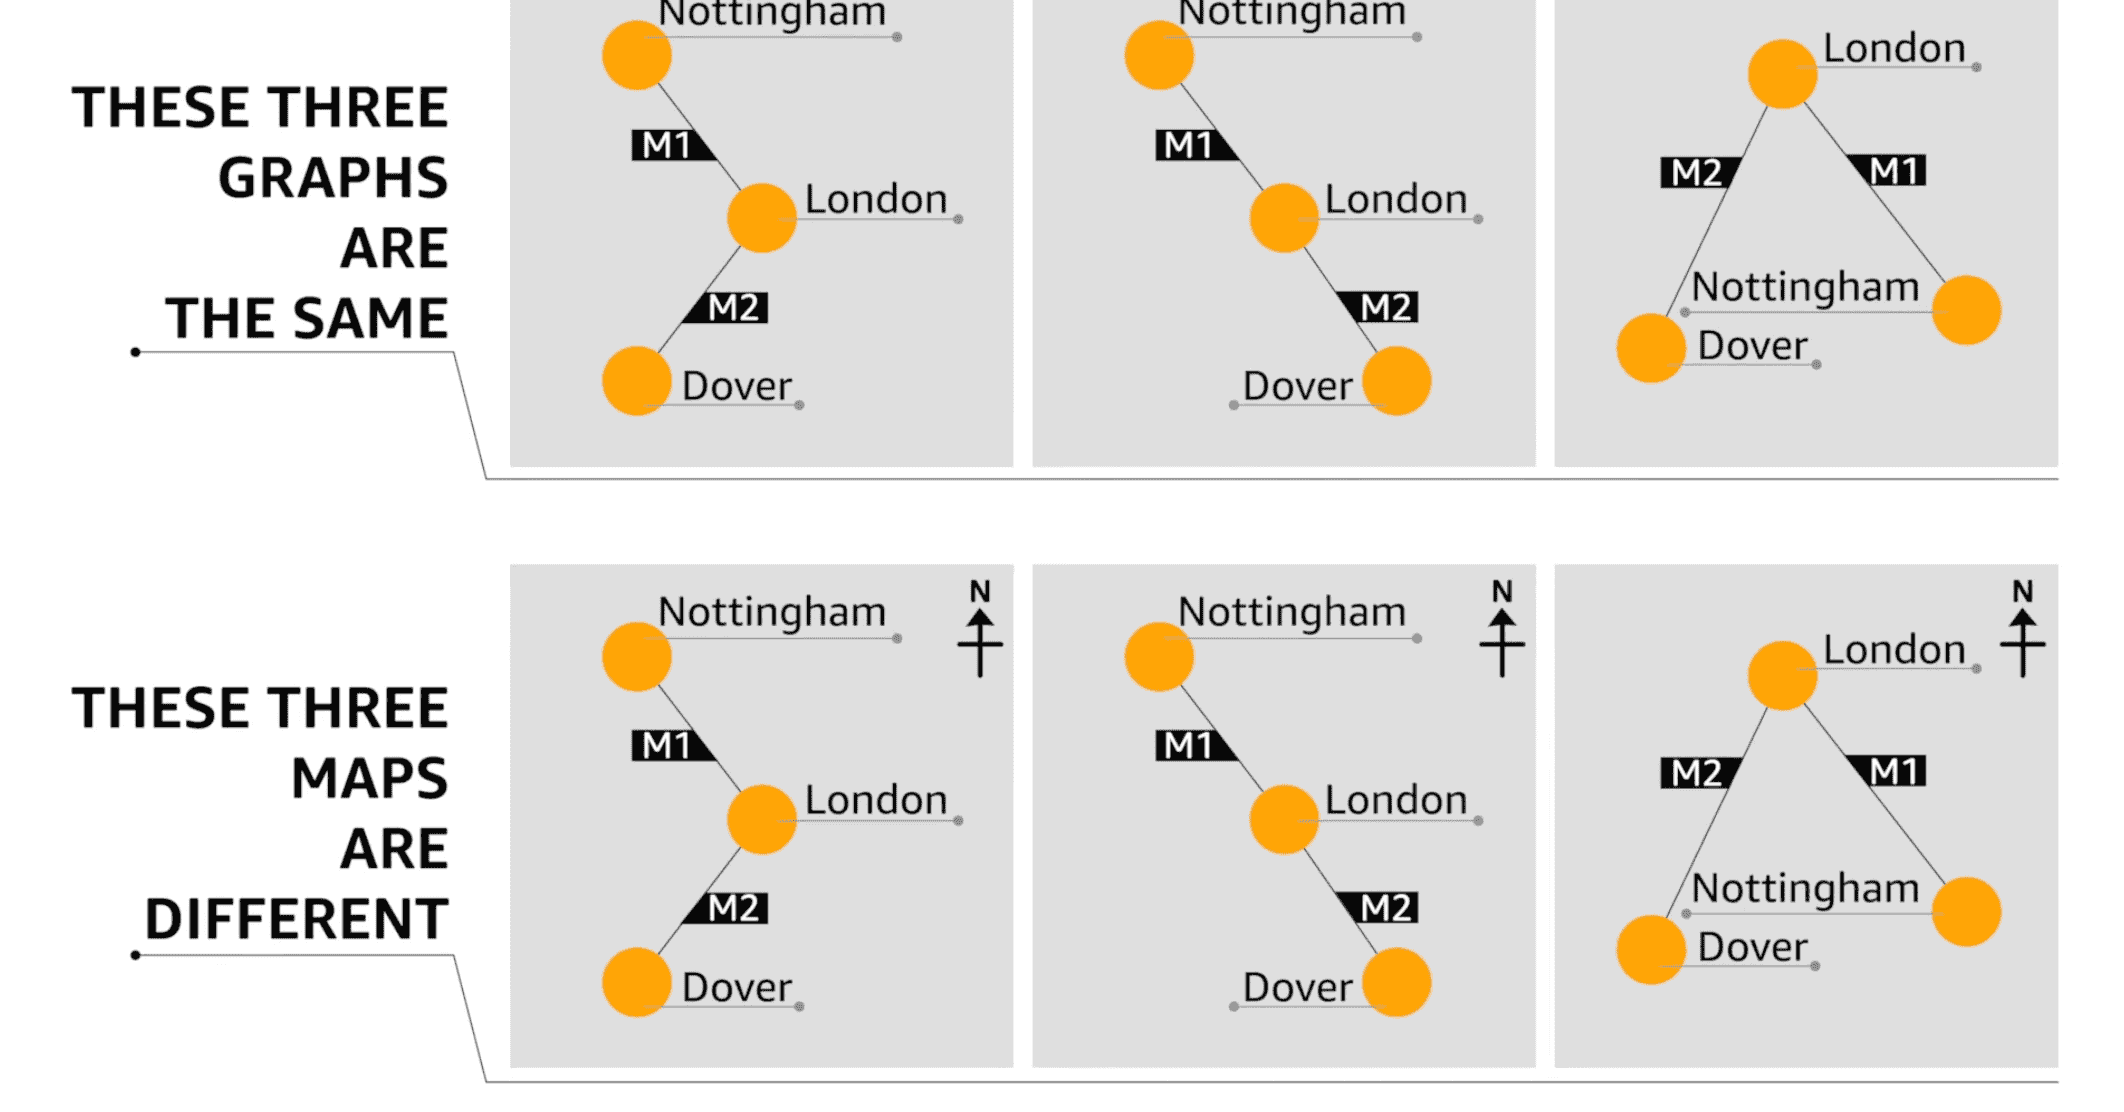
Space has meaning in real world maps and economic and strategic maps
And when translated to a Wardley map, the axes are visibility and innovation:
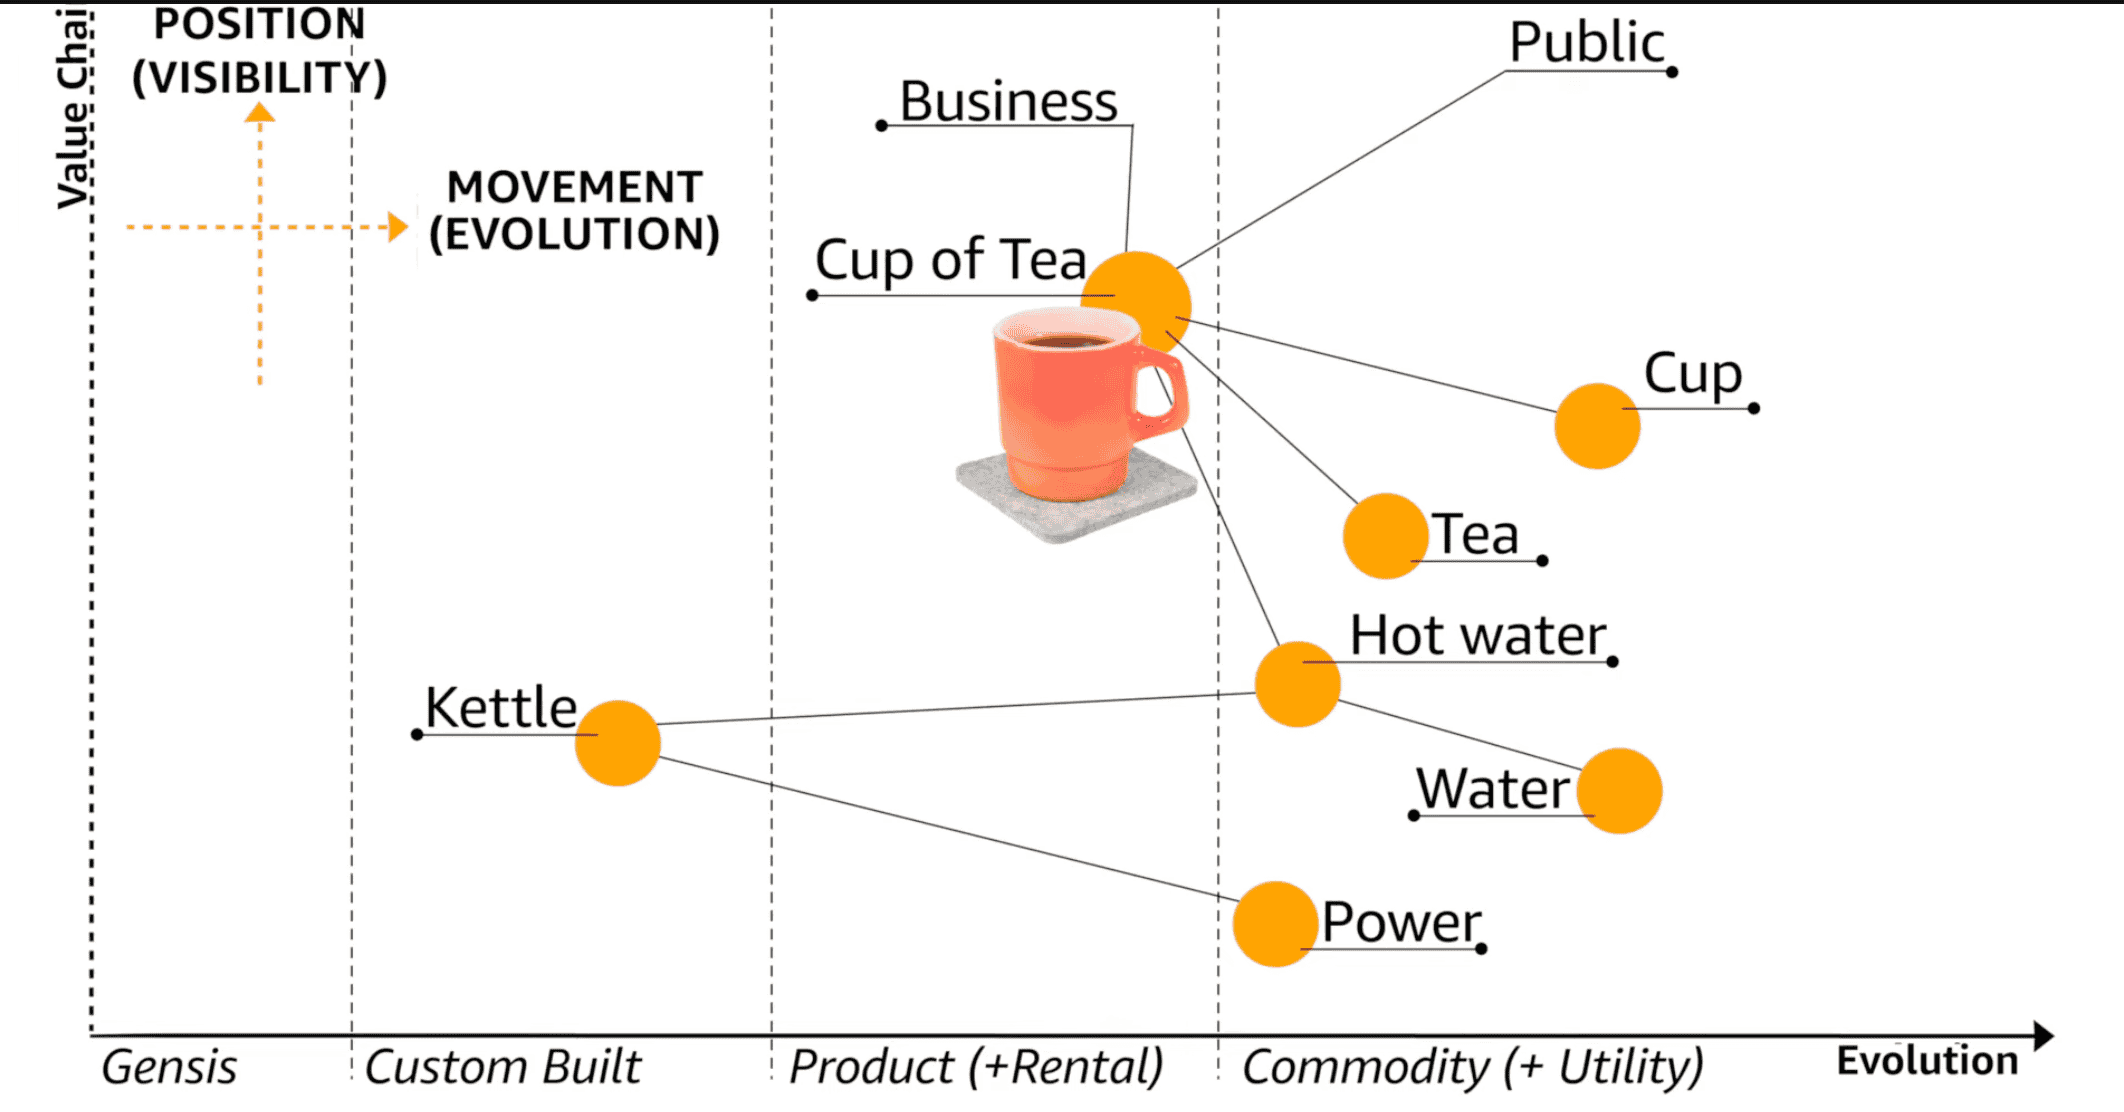
Wardley map axes
If you look carefully you’ll see that the Y axis is not labeled User Visibility it’s labeled Value Chain. It’s OK to rename axes to better reflect the context of the map, but user centricity is the point.
Doctrine Informs Map Location #
User centricity is part of the overall doctrin. This is how you decide where things are on the map and where they should go. Which means being deliberate in choosing the axes of the map. Where do you put Item X on the map? Think about what is (current situation) and what should be by using doctrine to guide your decision about evolution.
- Know your users. There could be more than one type.
- Focus on user needs.
- Know the details. Dependencies are important because that’s what poor investment allocation can show up.
- Understand what is being considered. What is the state of each of the elements of the system?
- Challenge Assumptions. We are trained to think in stories, but stories can be misleading.
Movement or Evolution is the Point #
The X axis Wardley chooses is technical evolution. The theory is that investment should happen further to the top-left—high user visibility and high innovation–and very low on the bottom right—commodities that have low user visibility.
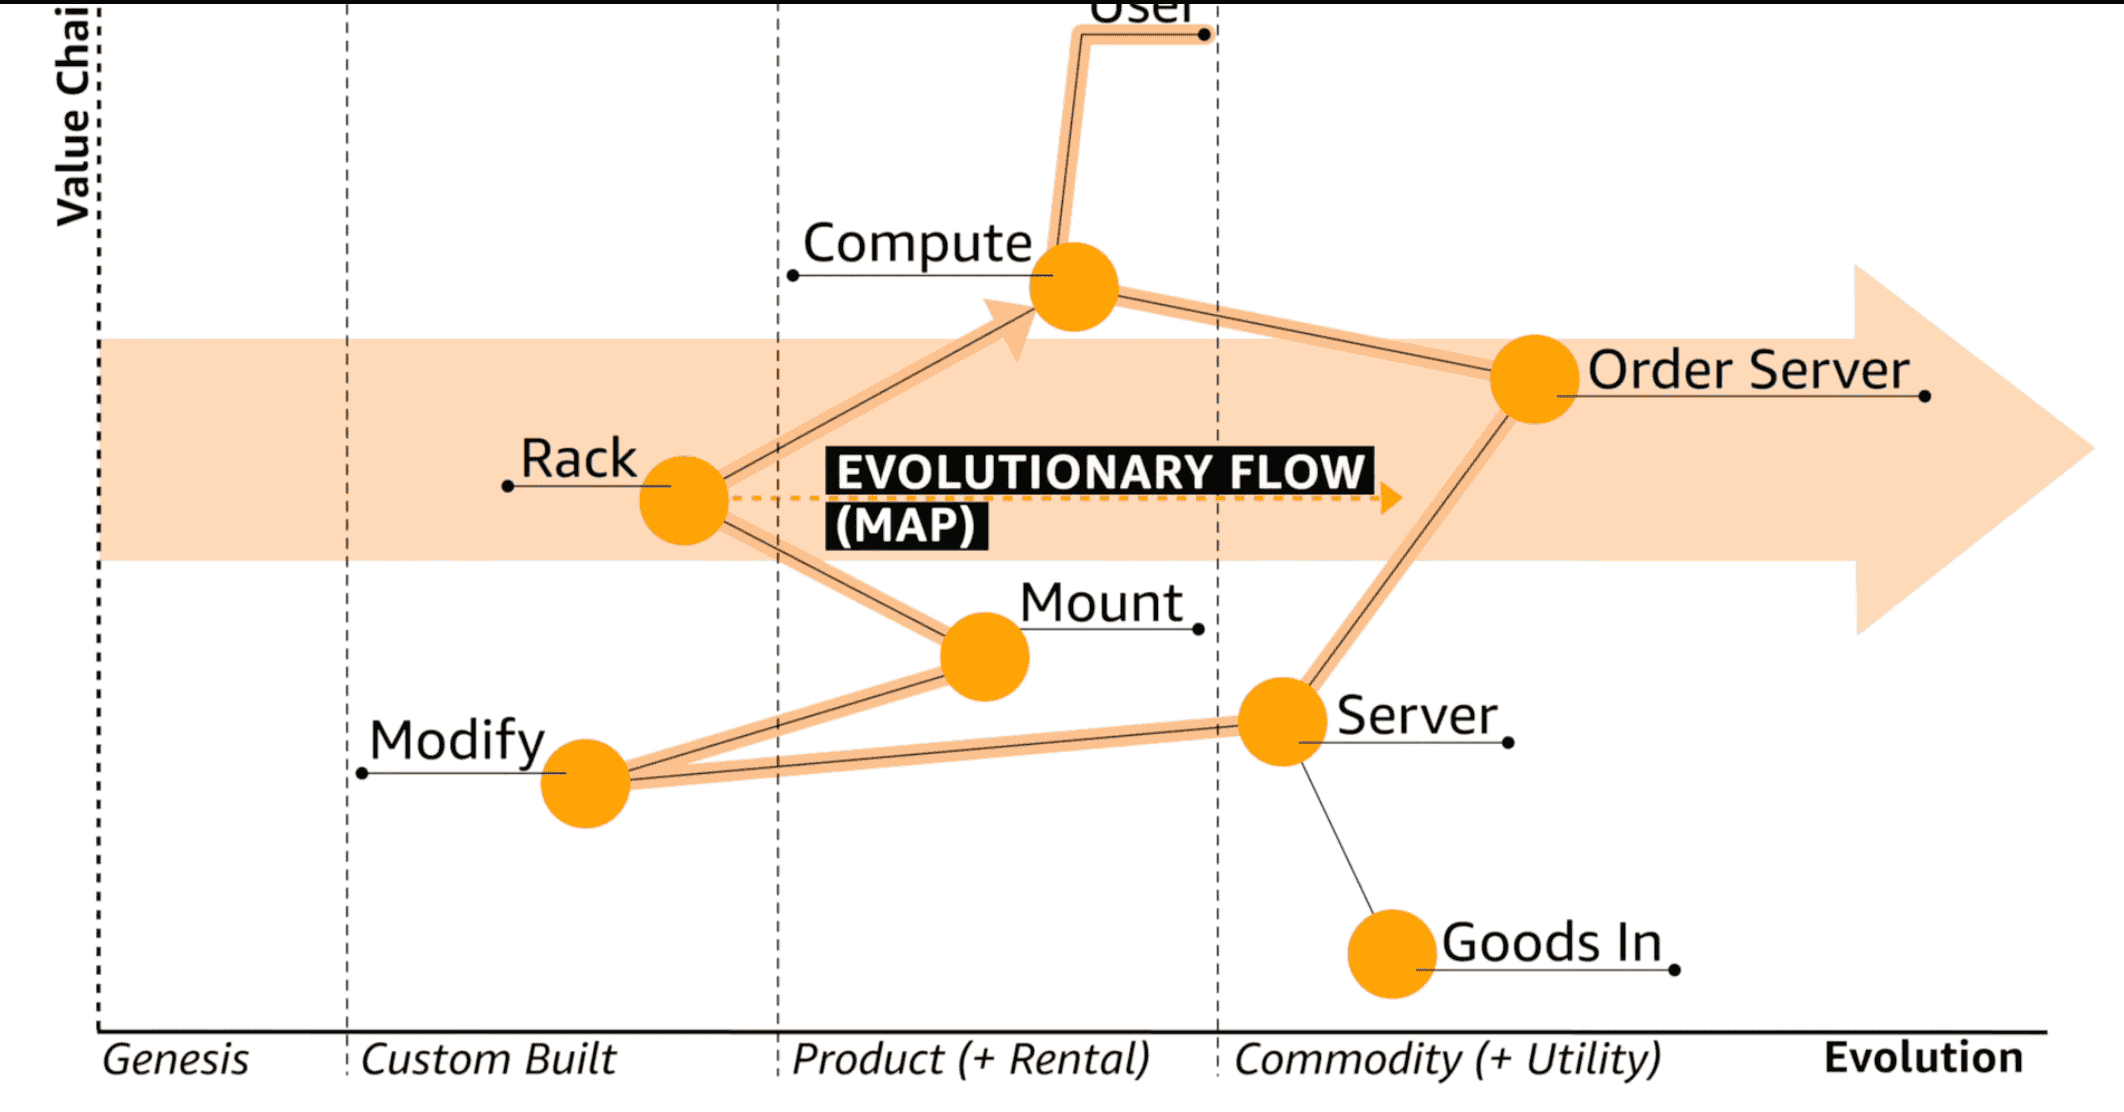
Evolution towards commoditization
This implies movement. Shifting investments away from commoditized areas and towards areas of high user visibility and innovation.
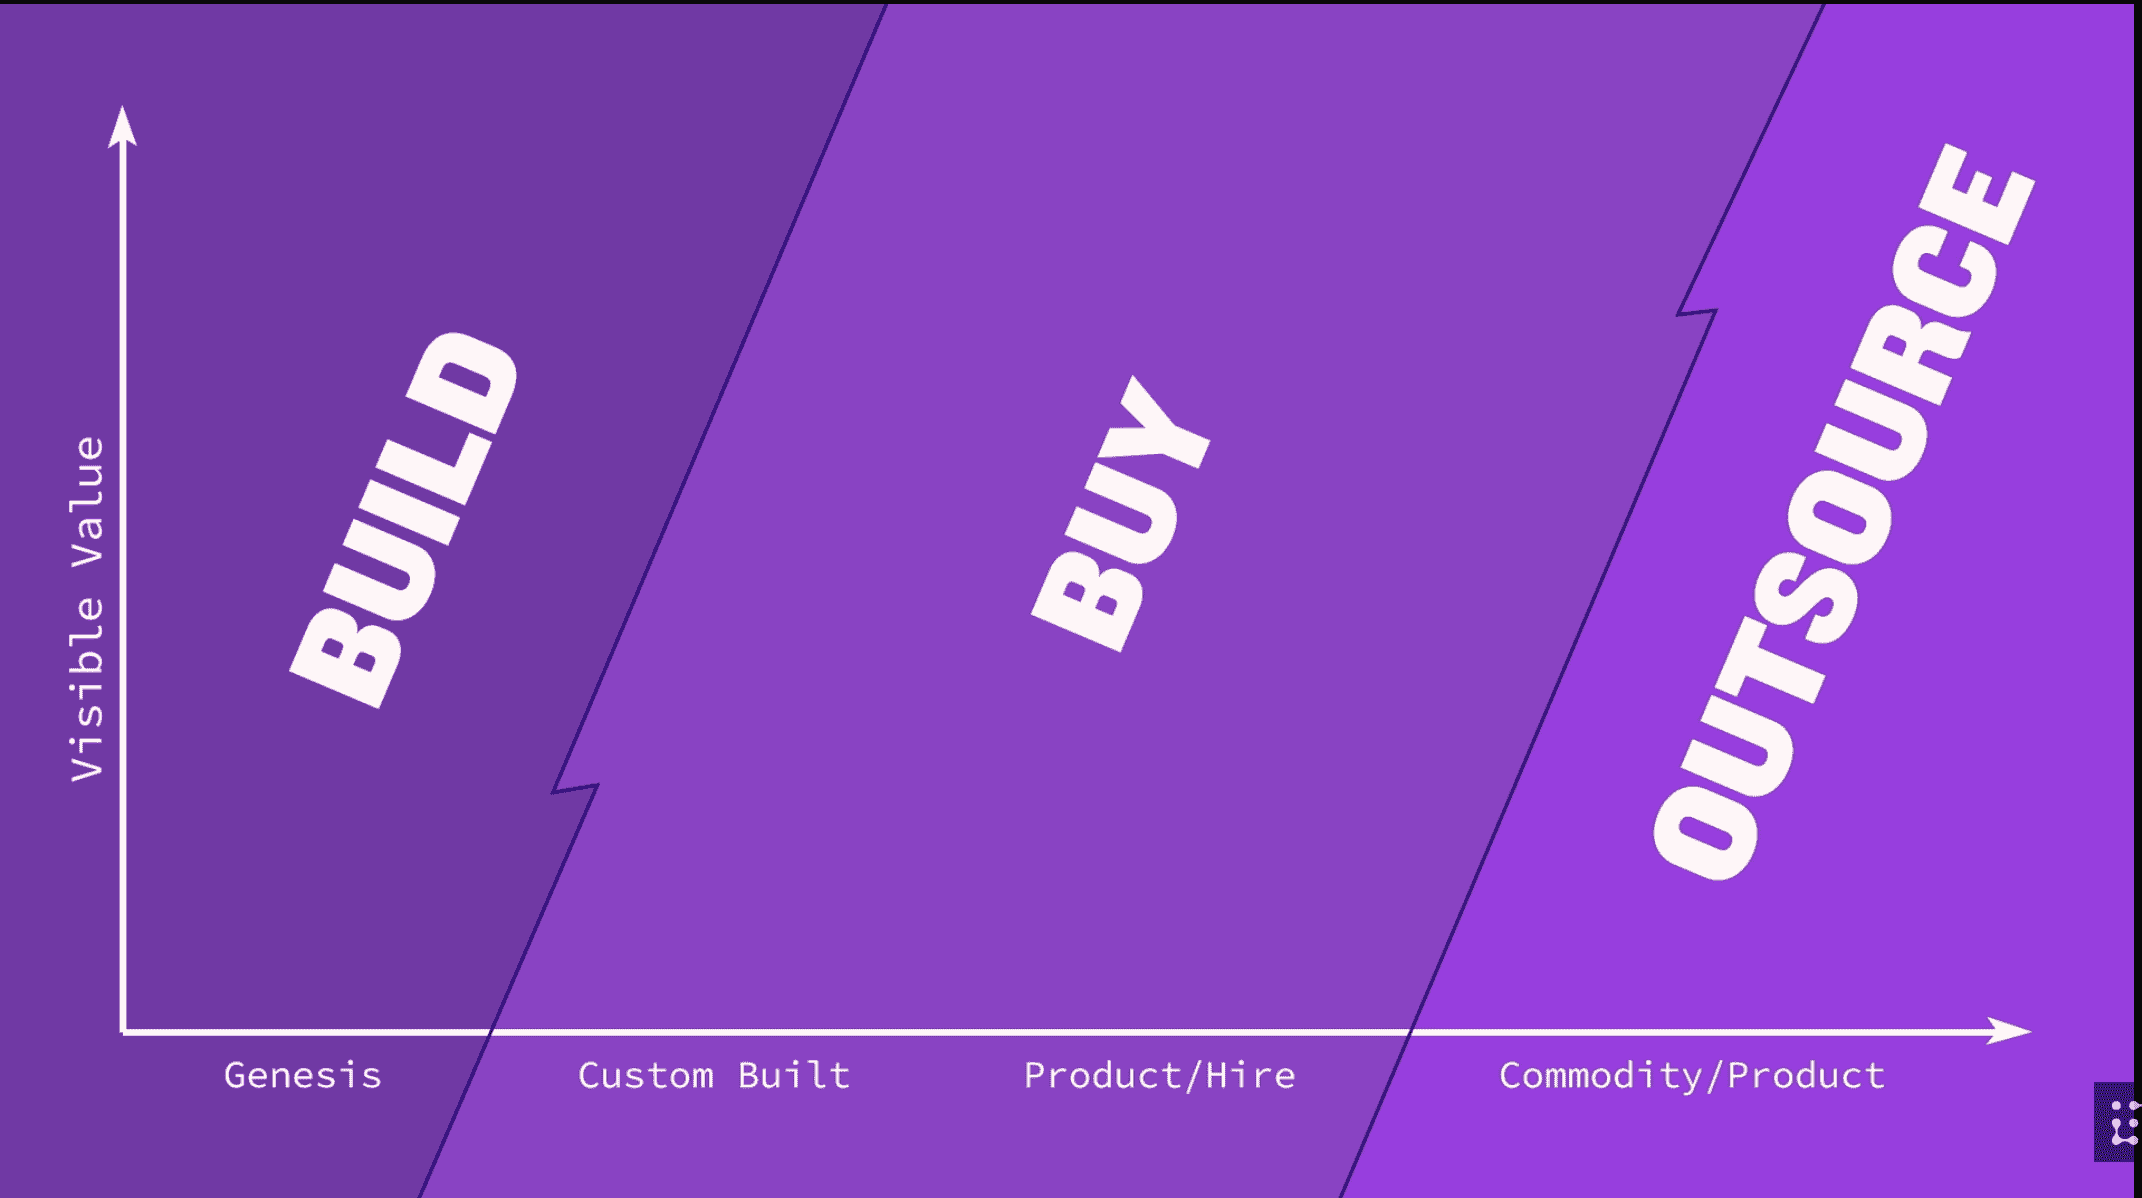
Evolution is a good indicator for where to invest and where to outsource
I’ve seen this in companies that invest heavily in their own infrastructure for very good historical reasons but that no longer make sense in the current climate: neither a key distinguisher to customers nor important for operation or financial reasons.
This evolution only happens if there is supply and demand! Without that there’s not incentive for things to evolve.
Working Style per Evolution #
- Use agile (true agile) for early stage and innovation
- Use lean for middle stages.
- Six Sigma and similar. Outsource with quality controls
And if you’re building a contract or project that encompasses different working styles, expect delays! For exmaple, if an outsourcing contract includes innovation aspects, it’s hard to avoid disruptive change across the whole contract.
Tools #
Online Wardley Maps is a great tool that is text-based: my preferred approach to diagrams!

Wardley Maps Online supports iterations to show evolution
Resources #
- Learning Wardley Maps. I started with this site because the short videos helped me get oriented.
- Simon Wardley talking about Wardley Maps in an AWS Government series:
- Wardley Maps book. This is open under Creative Commons so I started reading. It’s absolutely fascinating, and the goal of killing off strategic and management consulting was quite a shocking goal to start with! But really, the detailed articulation of the journey from accidental strategy through Sun Tzu to doctrine, etc., is really interesting. I definitely did not complete that book yet.
- Online Wardley Maps. This is the good stuff. A way to write in a simple domain specific language (DSL) for Wardley Maps. The examples repo has some wonderful examples to get oriented.
- VS Code extension. With the usual
Ctrl+Cmd+P > Install ExtensionI could add this quickly. My only gripe thus far is that you cannot export or save the resulting image. It’s OK because you can paste the exact same DSL text into the online mapping tool and get the same result. But that’s kind of a drag in the longer term.
This was first written in 2021 when that what a thing. ↩︎